How to Read Basic Financial Reports Even if You Are Not an Accountant
Financial reports can feel like a foreign language. Numbers, jargon, tables, and charts can intimidate even experienced business owners. But …

Financial reports can feel like a foreign language. Numbers, jargon, tables, and charts can intimidate even experienced business owners.
But understanding your business’s finances doesn’t require an accounting degree. With the right approach, you can read balance sheets, income statements, and cash flow reports and make smarter decisions for your business.
This guide shows you how to understand financial reports clearly, without stress or guesswork.
Why Understanding Financial Reports Matters
Even if you are not an accountant, reading your financial reports is essential.
It helps you:
-
Make informed business decisions
-
Avoid financial surprises
-
Communicate effectively with accountants, investors, or lenders
Financial literacy is one of the fastest ways to protect and grow your business.
Suggested read: The “Agency” Dilemma: Managing Project-Based Finances vs. Recurring Revenue
A Short Story: How Numbers Tell a Story
Amara runs a small online store selling handmade crafts. She felt confident because sales were coming in, but she rarely looked at the reports her accountant sent.
One month, she noticed a sudden drop in profit. Her accountant showed her the income statement and balance sheet. Amara realized that shipping costs had increased significantly, and some customer refunds were not accounted for.
By learning how to read her reports, she identified where money was leaking and made smarter decisions, like renegotiating shipping rates and updating refund tracking. Her profits stabilized, without any extra sales.
Understanding the Three Key Financial Reports
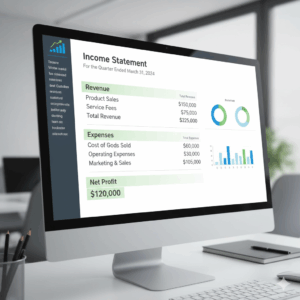
1. Income Statement (Profit & Loss Statement)
The income statement shows how much money your business earned and spent over a period.
Key elements to focus on:
-
Revenue / Sales – money coming in from your business activities
-
Cost of Goods Sold (COGS) – direct costs to make products or deliver services
-
Gross Profit – revenue minus COGS
-
Operating Expenses – rent, salaries, marketing, utilities
-
Net Profit / Loss – what’s left after all expenses
Tip: Look for trends. Is revenue growing? Are expenses increasing faster than sales?
Suggested read: Business vs. Pleasure: The Danger of Commingling Funds
2. Balance Sheet
The balance sheet shows what your business owns (assets), owes (liabilities), and the owner’s equity at a specific point in time.
Key sections:
-
Assets: cash, inventory, accounts receivable, equipment
-
Liabilities: loans, accounts payable, other debts
-
Equity: your ownership stake (assets minus liabilities)
Tip: A healthy balance sheet has more assets than liabilities and shows how your business is funded.

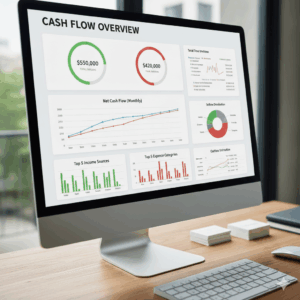
3. Cash Flow Statement
The cash flow statement explains where your cash comes from and where it goes.
Three main parts:
-
Operating Activities: cash from sales and payments
-
Investing Activities: buying or selling equipment, property, or investments
-
Financing Activities: loans, repayments, or investor funding
Tip: Even profitable businesses can fail if cash flow is poor. Track cash to ensure your business can pay bills and invest in growth.
Suggested read: The Role of Technology in Financial Inclusion for Nigerian Entrepreneurs
Simple Steps to Read Any Financial Report
-
Start with the summary numbers – revenue, net profit, total assets, total liabilities.
-
Compare over time – month-to-month or year-to-year trends reveal growth or problems.
-
Highlight key ratios – gross profit margin, current ratio, debt-to-equity ratio.
-
Ask questions – any unexpected number deserves a closer look.
-
Use visuals – charts, graphs, and color coding make numbers easier to understand.
Common Mistakes to Avoid
-
Ignoring reports until problems arise
-
Focusing only on revenue, not profit or cash flow
-
Being intimidated by accounting terms
-
Skipping comparisons to previous periods
-
Not asking your accountant to explain unclear numbers
How Financial Tools Can Help
Modern tools simplify financial reporting for non-accountants. They can:
Suggested read: The Future of Accounting Careers in Nigeria: What Graduates Should Expect
-
Automatically generate income statements, balance sheets, and cash flow reports
-
Highlight unusual transactions or trends
-
Provide visual dashboards for quick understanding
Using tools like Zaccheus allows you to see your financial health at a glance and take action without needing deep accounting knowledge.
Best Practices Summary
To read financial reports confidently:
-
Focus on income statement, balance sheet, and cash flow statement
-
Look for trends over time
-
Pay attention to key ratios
-
Highlight important numbers and ask questions
-
Use financial tools for clarity
Financial reports are not scary, they are your business’s story in numbers. The more you read them, the smarter your decisions become.
Suggested read: How to Manage Multi-Currency Payments as a Nigerian Exporter
Frequently Asked Questions (FAQ)
Can I understand reports without accounting knowledge?
Yes! Focus on summaries, key numbers, and trends. Tools and guides make it easier to interpret data without being an accountant.
How often should I check financial reports?
Monthly is ideal for small businesses. Quarterly reviews work for low-activity businesses, but don’t wait until year-end.
Which report is most important?
All three reports complement each other. For day-to-day decisions, focus on cash flow and income statements. For long-term planning, review the balance sheet.
What is a ratio in financial reporting?
A ratio compares two numbers to understand business health. Examples include gross profit margin (profit ÷ revenue) and current ratio (assets ÷ liabilities).
How do I track trends over time?
Compare reports month-to-month or year-to-year. Highlight increases, decreases, or unusual changes. Graphs can help visualize trends quickly.
Suggested read: Hiring Your First Accountant: What to Look for (And What AI Can Do Instead)
Conclusion & Call to Action
Reading financial reports does not have to be intimidating. Even without an accounting background, you can understand the numbers that matter, spot trends, and make informed decisions for your business.
With consistent practice and the right tools, financial reports become your roadmap for growth and profitability.
Zaccheus makes it simple for entrepreneurs to see their financial health clearly, understand the story behind the numbers, and make confident business decisions.
👉 Start reading your financial reports today with n and turn numbers into actionable insights for your business.